Why Does My Page “Not Pass” the Core Web Vitals Assessment?
Posted by Surgeon’s Advisor

What Are Google Core Web Vitals and Why Do They Matter?
Core Web Vitals are an integral part of Google’s ongoing efforts to prioritize user experience on the web. They encompass three distinct performance metrics: Largest Contentful Paint (LCP), First Input Delay (FID), and Cumulative Layout Shift (CLS). As Google puts it, these Core Web Vitals “measure dimensions of web usability such as load time, interactivity, and the stability of the content as it loads.”
Largest Contentful Paint refers to the amount of time it takes for the largest content element on a web page to be fully loaded and visible. This element could be an image, a video, or a block of text. First Input Delay is the amount of time it takes for a web page to respond to a user’s first interaction, such as clicking on a link or tapping on a button. Cumulative Layout Shift is a metric that measures the visual stability of a web page during the loading process, which is critical for providing a seamless browsing experience and to asses unexpected layout shifts.
Optimizing these Core Web Vitals metrics is essential for website owners and developers to prioritize the user experience and improve their website’s overall search rankings on Google search results pages. By ensuring that their web pages load quickly, respond promptly to user input, and maintain visual stability, website owners can provide outstanding user experiences that keep their visitors engaged and satisfied.
Core Web Vitals
Many webmasters have been struggling with their pages still showing as failing URLs in the Core Web Vital dashboard despite many efforts and fixes.
What is happening?
We believe this is caused by the number of pages that have insufficient traffic for Google to collect the data which in turn has a negative impact on search engine rankings. While this is not difficult to understand, we will need to explain what you see in the Page Experience dashboard and how that correlates with the PageSpeed Insight test.
Let’s start with the relatively new Page Experience dashboard.
The Page Experience dashboard

Google recently changed the Page Speed dashboard to the new “Page Experience” dashboard. This is a new way to look at different metrics that affect a web page from the perspective of user experience. Specifically, the Core Web Vitals metrics including First Contentful Paint (FCP), First Input Delay (FID), Largest Contentful Paint (LCP), and Cumulative Layout Shift (CLS) to measure visual stability are the ones giving us the headache.
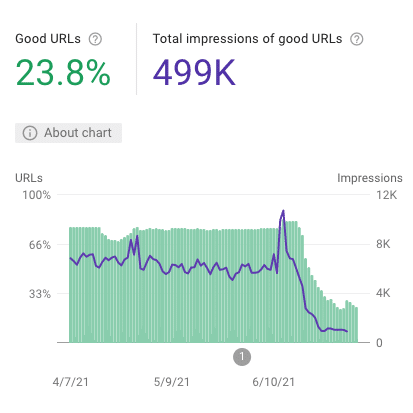
Core Web Vitals’ Good URLs
The percentage of “Good URLs” showing in the dashboard (The Core Web Vitals scores) are the pages passing all four metrics, and it is directly related to the number of “Impressions.” The weight of these metrics in the new Page Experience Algorithm update will always remain a mystery, but it is clear that right now, considering the changes in the ranking positions we have seen this year, the weight is very high.
The PageSpeed Insight test
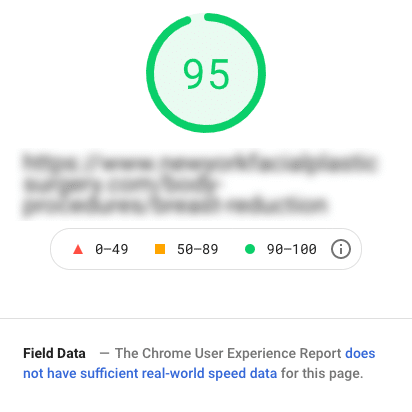
When testing a page using the PageSpeed Insight test, the resulting score on the big green bubble seems to tell us that everything is great. We are winning! But wait. Apparently, Google is degrading the importance of the speed score using the score of the four metrics mentioned above (the Cumulative Layout Shift and the others). As we keep reading the test result, we see that the first paragraph below the score says:
Field Data – The Chrome User Experience Report does not have sufficient real-world speed data for this page.
From PageSpeed Insight test
What is that supposed to mean? The reason why this is the first paragraph right after the “score” number is because it directly impacts the results of “Good URLs” that Google Search Console is showing in the Page Experience dashboard.

Examining the Results of the Core Web Vitals Evaluation
Core Web Vitals test results depend on the collection of 28 days of Field data. If pay attention to the PageSpeed Insight test, you may have noticed that you have Field data and Lab data:
- Field data: This represents real-world historical data collected by Google through actual users using the Chrome browser. These are the results that count in the “Good URLs” percentage.
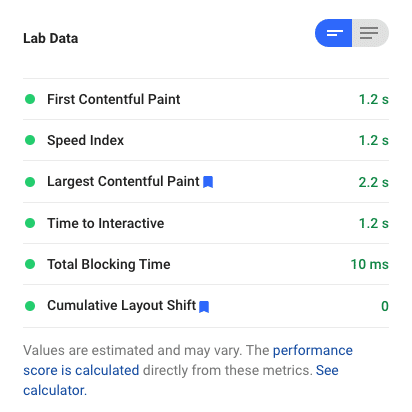
- Lab data: This is a simulation that happens when you submit the page to the test.
As Google well explains in the FAQs section of the Google Page Speed Insight test, the two results may contradict each other. One is real historical data, and the other is just a one-time simulation.
But wait, what happens if I fix my page, but my page does not have enough traffic for Google to collect 28 days of data?
Why Does My URL Still “Not Pass” the Core Web Vital Test?
We did another test for URLs not passing the test. We went to the Core Web Vitals dashboard and clicked on the URL fails.

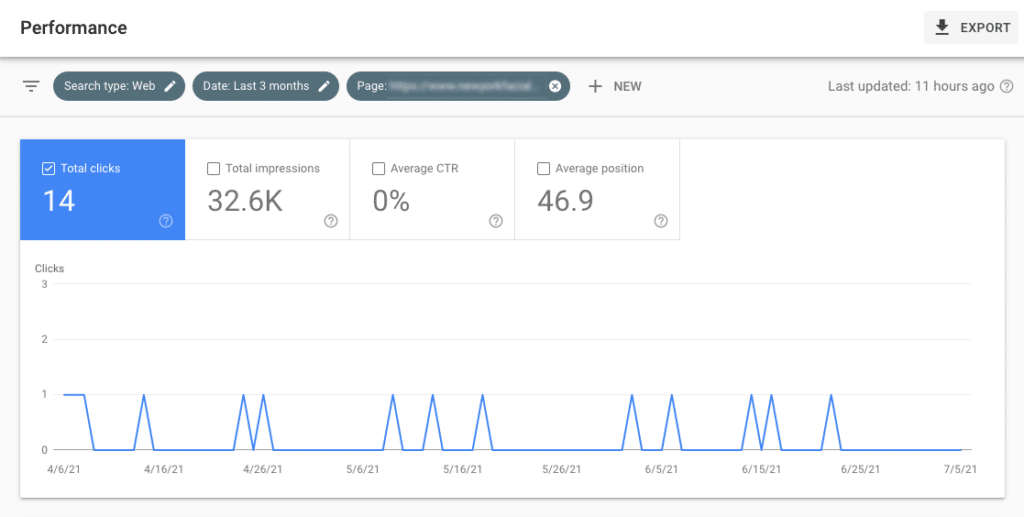
From there, we copied the URLs and checked the Clicks data for three months for each URL on the Performance Dashboard of the Search Console. What we found was that many URLs do not have enough clicks, so they will still show up as “failing” URLs even when we have fixed the issue. In the example below, the page in question has had only 14 clicks in 3 months. If the 14 clicks are divided between Chrome and other browsers, then when will Google collect 28 days of historical data? In about 6 months? In another year? It depends on many factors.

How Important Is the Lab Data?
We know we have fixed the issue when the Lab data shows all the metrics in green. Still, these pages “do not pass” the assessment because the Field data “does not have sufficient real-world speed data.” So, do not be discouraged by the results shown in Search Console. The Lab data simulation is proof that you did it right. So what is the next step?
If the Lab data is telling you everything is alright, but the Core Web Vitals report keeps showing failing URLs, then there is one more step to take: Delete the pages that do not have enough traffic.
Wait, what? Let’s say that you have 100 pages on your website. You fixed all of the Core Web Vitals common issues on each page. But of the 100 pages, only 20 have “sufficient real-world data.” In the eyes of Google, only 20% of your website has good URLs.

Does Google Want You to Get Rid of Irrelevant Pages?
Apparently, yes. Think about this: if these pages affect your site’s search performance and do not have traffic, what is the purpose of having them on your website? To find out, do a Page Experience score content audit. You can use SemRush or AHREFS tools to perform the audit. Select a year of traffic data and create a report of clicks and backlinks. Set your own limits of what you consider important, but a page with less than 50 visits and no backlinks in a year has no practical use for your site.
We have tested this strategy. Guess what? Websites started to show more “Good URLs!”
Improve Core Web Vitals Results
Core Web Vitals refer to three specific metrics that Google uses to measure whether a website is providing good user experiences: loading speed, user interactions, and visual stability. These are all SEO ranking factors that have a direct impact on a website’s success.
To improve website performance, you should identify which Core Web Vitals metrics your site is not meeting. Google’s PageSpeed Insights tool can help analyze website performance and highlight areas for improvement. Once identified, you can take steps to enhance website performance and improve the experience for users.
After identifying areas of concern, you can apply effective methods to improve website performance, fix slow server response time issues, and enhance real user experiences.
- Optimize Images and Media – Large images and media files can significantly slow down your website’s loading time and hurt your Core Web Vitals metrics. Optimize any images or videos on your website for the web, and make sure their file size is not too large.
- Minimize the Use of JavaScript — Excessive use of JavaScript on your website can also slow down the loading speed. Strip any unnecessary JavaScript code and reduce its usage on your website’s critical rendering path.
- Defer Loading of Non-Critical Resources – To prioritize the loading of critical resources that affect your Core Web Vitals metrics, consider deferring the loading of non-critical resources. This will ensure that the most important elements of your website load first.
- Prioritize Critical Resources for Faster Loading – Prioritize any critical resources on your website, like CSS and JavaScript files, for faster loading. This means making sure that they are not blocked by other resources and are loaded as quickly as possible.
- Upgrade Your Hosting Plan – If your website is hosted on a slow server, this can negatively affect your Core Web Vitals metrics. Consider upgrading your hosting service to a more powerful server to improve your website’s loading speed and performance.
- Use a Content Delivery Network – A content delivery network (CDN) is a network of servers that can help improve a lazy loading speed by caching content and delivering it from the server closest to the user.
Remember, improving your Core Web Vitals metrics is an ongoing process. Continuously monitor your website’s performance with real-user monitoring tools like Google Analytics to identify areas for improvement and make adjustments as needed to ensure that your website meets Google’s standards for a smooth user experience.
FAQ
Good URLs are the percentage of mobile URLs with both Good status in Core Web Vitals and no mobile usability issues according to the Mobile Usability report in Search Console. Mobile optimization is important now more than ever so if you want your website to be good in this metric, you should ensure that your site has a responsive design, fixed width and height attributes on images, optimized dynamic content, and carefully managed font loading.
Field data is the real-world historical data collected by Google through browser users and mobile users using the Chrome browser. These are the results that count in the “Good URLs” percentage.
Lab data is a simulation that happens when you submit the page to the test. These simulations DO NOT count in the “Good URLs” percentage.
Irrelevant pages have no meaningful amount of traffic and no backlinks within a year timeframe, though the amount of traffic, backlinks, and timeframe can change according to the website.
You can take steps to improve the load time of a page and other metrics. For instance, you can remove excessive CSS files and unnecessary third-party scripts, reduce the image size and give them proper size attributes, implement lazy load, and make sure that Google Lighthouse shows every score in the green (for both the desktop version and the mobile version). If you’re a business owner or just don’t have the technical skills, you can ask your webmaster to reduce the size of the site’s largest elements and optimize the layout for mobile devices and for real users, not just Google.

Afraid of a radical solution? We can help.
Contact us. We are a company with 20 years of experience in the SEO industry. We can provide a free evaluation of your website—not the typical automated report of what is wrong with your site and the magical one-click ideal solution, but a real report of where your website stands right now and the solutions we can use to fix it.